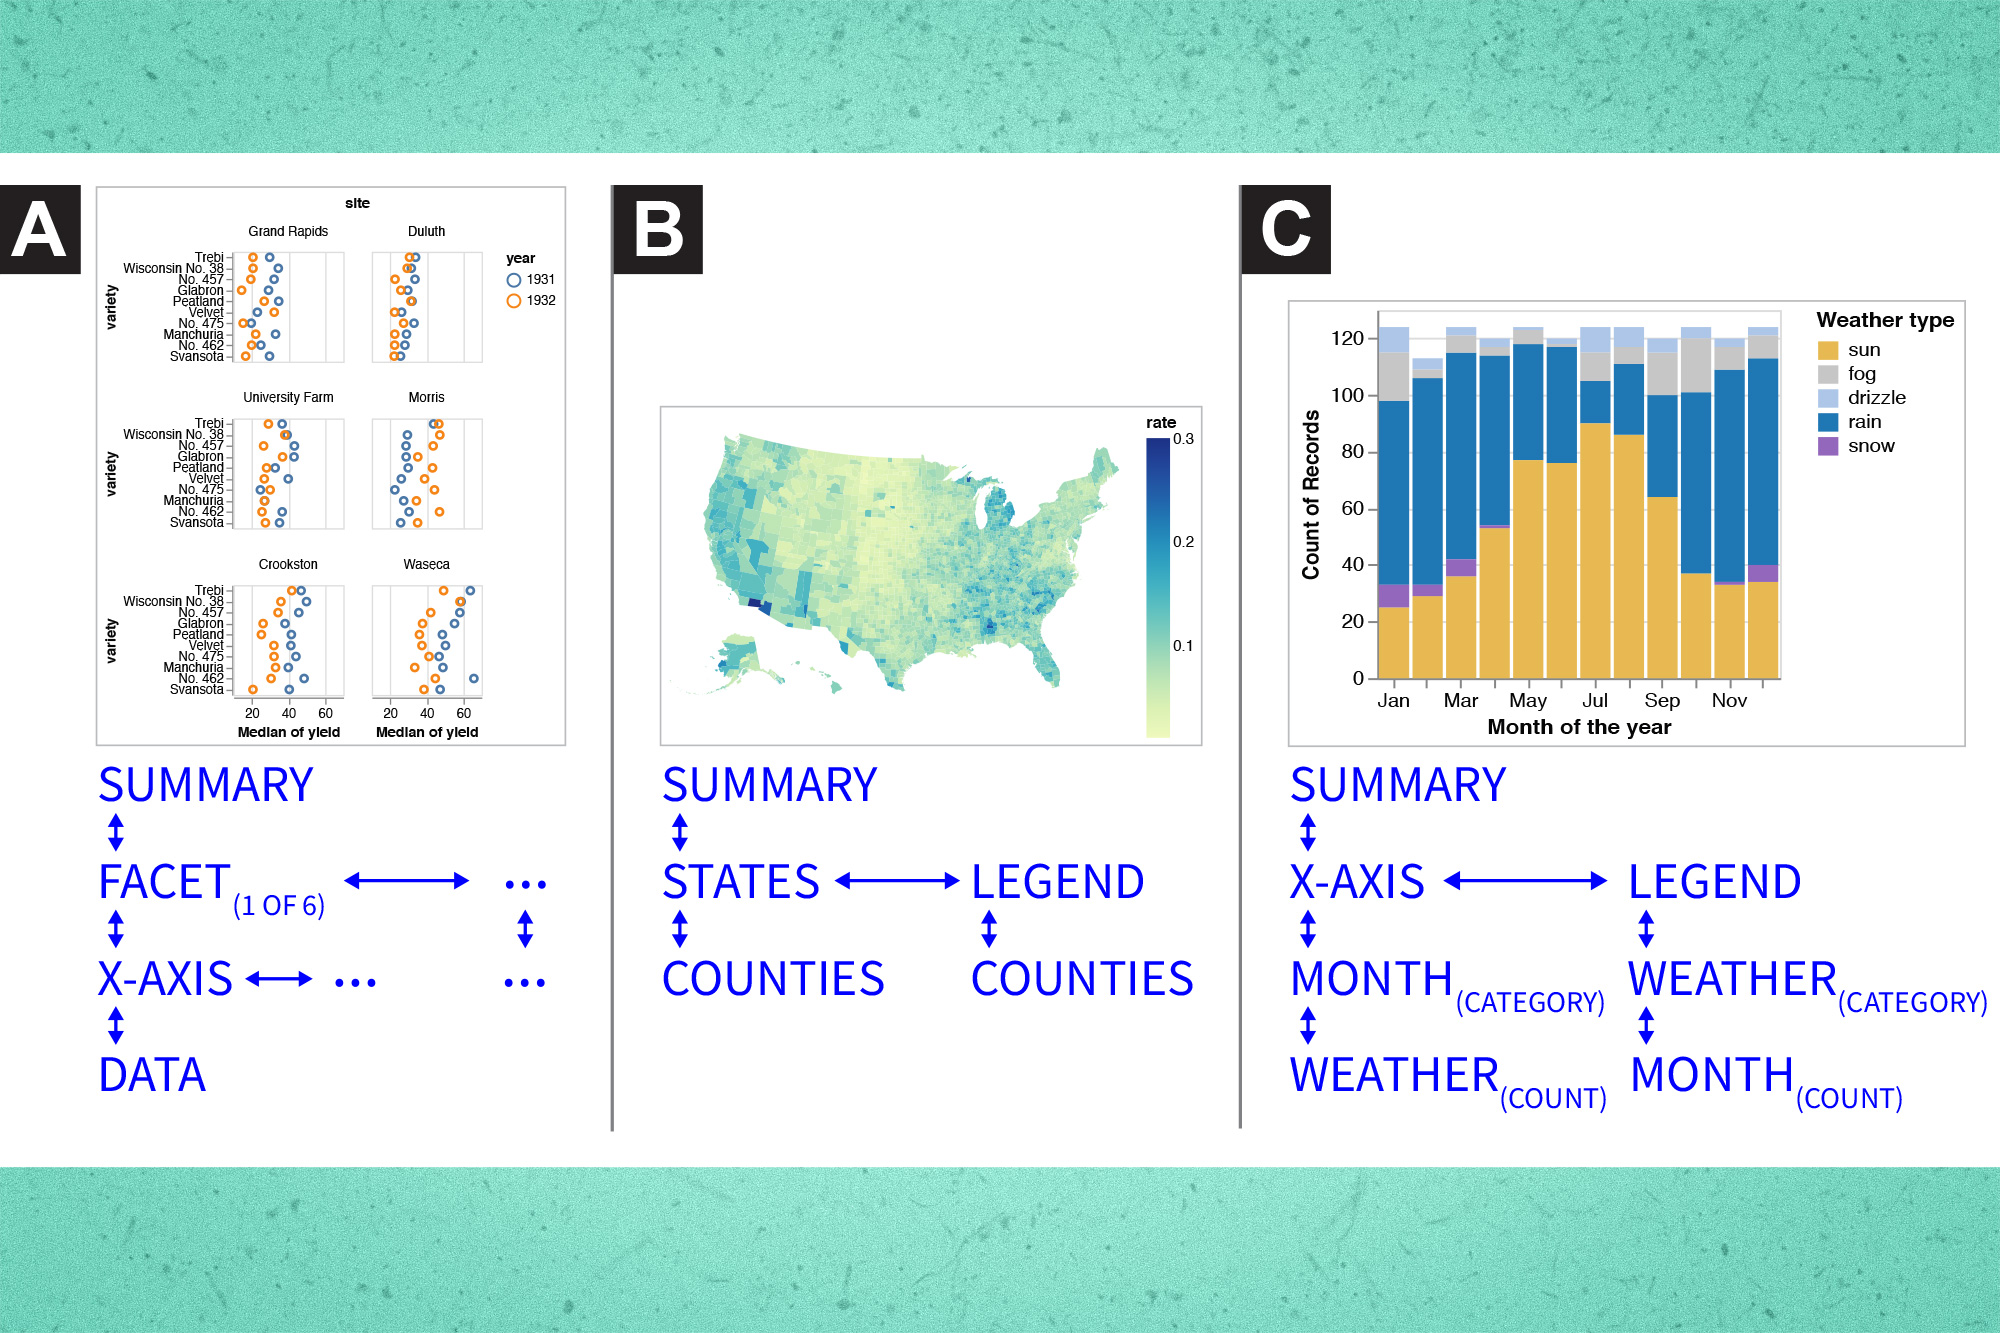
Data visualizations on the web are largely inaccessible for blind and low-vision individuals who use screen readers, an assistive technology that reads on-screen elements as text-to-speech. This excludes millions of people from the opportunity to probe and interpret insights that are often presented through charts, such as election results, health statistics, and economic indicators. When a designer attempts to make a visualization accessible, best practices call for including a few sentences of text that describe the chart and a link to the underlying data table — a far cry from…


